Network graphing in JavaScript - force-graph
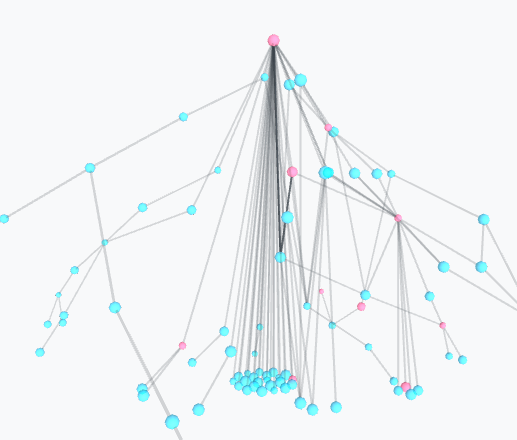
分析網路關係,並將資料視覺化,最常見的就是 network graph。
常見套件
- https://github.com/vasturiano/3d-force-graph
本文主角,支援 3D 與圖互動。 - https://github.com/vasturiano/force-graph
本文主角,支援與圖互動。 - https://github.com/jacomyal/sigma.js
文檔寫在程式碼與範例中,需要參考它的範例原始碼。將圖展開可以使用它提供的 plugin forceAtlas2,與圖互動需要自己 coding 擴充。 - https://github.com/cytoscape/cytoscape.js
提供許多範例可以參考。 - https://github.com/almende/vis
不只做 network graph,可上官網參考範例。 - https://github.com/davidpiegza/Graph-Visualization
支援 3D,文檔並不齊全,需要參考它的範例原始碼
最易用的套件
force-graph 當之無愧,因為它幫我們跳過了底層 canvas / three 繁瑣的設置,也預設了展開圖中各點的演算法 DAG ,開發者只需要指定要畫在哪個 html dom 上,輸入 data 就能見到一張漂亮的圖,若是要客製化某些功能,也能透過其提供的 API 設置顏色事件等等。

詳細的 API 請見:
https://github.com/vasturiano/force-graph
https://github.com/vasturiano/3d-force-graph
範例
Network graphing in JavaScript - force-graph
https://blog.yang-hong-xin.com/network-graphing-in-javascript-force-graph/


